
Analysis of a population of cell which are actively replicating can be achieved by fluorescence labeling of the nuclei and then analyzing the fluorescence properties of each cell in the population. Quiescent and G1 cells will have one copy of DNA and when stained with stoichiometric fluorescent intercalating dyes will have 1X fluorescence intensity. Cells in G2/M phase of the cell cycle will have two copies of DNA and accordingly will have 2X intensity. The cells in S phase are synthesizing DNA and thus will have fluorescence values between the 1X and 2X populations. The resulting analysis histogram consists of three populations: two Gaussian curves (1X and 2X peaks) and the S-phase population.
Propidium Iodide (PI) is most commonly used as a fluorescent molecule that intercalates into the major groove of double-stranded DNA and can be excited at 488 nm with a broad emission centered around 600 nm. Since PI can also bind to double-stranded RNA, it is necessary to treat the cells with RNase for optimal DNA resolution. Certain cells have a tendency to adhere to one another forming doublets, triplets and aggregates. Despite the hydrodynamic focusing that occurs at the flow cytometer’s laser intercept, more than one cell sometimes passes through the laser simultaneously. This can result in the recording of what appears to be single cells with very bright fluorescence which are in actuality doublets or more e.g two cells in G0/1 that are stuck together will have as much nuclear fluorescence as one G2/M cell. As a result, during analysis, the G2/M percentages will appear erroneously high. The probability of doublets will increase when flowing at high event rates or a high pressure differential. Proper sample preparation and pre-filtering of the sample can minimize doublets or clumps of cells. Aggregates and simultaneously read events are sometimes unavoidable during the acquisition part of cell cycle analysis. Exclusion of “non-single” cells from later analysis is accomplished through the use of signal pulse processing by the cytometer and careful optimization by the operator.
This is done by preparing the following plots:
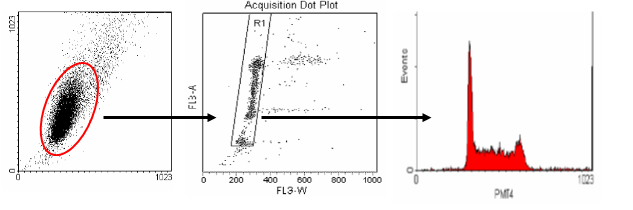 The middle plot shows pulse width versus area. This plot is used to distinguish between single cells and aggregates. Single cells (G0/1 or G2/M) will have similar pulse width (transit time) values. Aggregates will have larger width values and can be easily seen on the plot to the right of the single cell region. Single cells are gated and an FL2-Area histogram is drawn and formatted to show only the events inside of the single cell region.
For further information please contact us.